Satellite crop health: open source toolchain
Satellite imaginery is becoming an increasingly important tool for farmers everywhere, allowing them to monitor the health of their crops. It used to be, however, a very expensive service, out of reach for most people. Open data and open source are here to radically change that.

NASA / USGS
While extremely useful to monitor the health and growth of crops, satellite information is difficult to acquire and process. Until now, the only option was to resort to expensive commercial services.
However, recent open data and open source initiatives are working to enhance the access to this information. In this post I show how open source tools can be used to access, process and redistribute satellite imaginery as an accesible web map.
The basics
Let’s start from the beginning. How exactly does satellite imaginery help us to monitor crop health? One of the most commonly used metrics is called Normalized Difference Vegetation Index (NDVI). But how does it work?

Credit: John Whitmarsh
and Govindjee
Live green plants get their energy from light. They don’t use, however, the full spectrum of solar radiation: their chlorophyll absorbs visible light (0.4 to 0.7 µm wavelengths) while their cellular structure of the elaves rejects near-infrared light (from 0.7 to 1.1 µm) since photon energy at that band is not useful to synthesize organic molecules and would only serve to overheat the plant.
This means that the presence of healthy plants on the ground will affect the reflected sunlight, deepening the difference between visible content (VIS) and near-infrared content (NIR) of that sunlight. We can then devise a simple metric to quantify this relation, the NDVI:
%%% \text{NDVI}=\frac{(\text{NIR}-\text{VIS})}{(\text{NIR}+\text{VIS})} %%%
Note: many other, more sophisticated metrics exist for monitoring vegetation, but agricultural science is not the point of this post!
Now, if only we had something in the sky to measure these reflected sunlights bands, right? Fortunately, several satellites are dedicated to Earth Obervation. They employ a wide array of sensors, from cameras to radars to chemical analyzers. We are interested on those with certain characteristics:
- They’re capable of measuring VIS and NIR light bands
- Their imaginery is made freely available as open data
- An open source toolchain exists to process that imaginery
- Image resolution is high enough to distinguish particular fields
As you can imagine, few satellites reunite all these. But there are! The obvious candidate is NASA / USGS Landsat 8, one of the first whose data was made openly available. It is expected that ESA Sentinel-2 will shortly begin to provide regular data as well, but tools are not ready yet.
The satellite: Landsat 8
Landsat 8 is the last bird in a long and successful family of civilian Earth Observation satellites of the United States. It carries various intruments, but for now we’re interested in its Operational Land Imager, that can be regarded as a very fancy and expensive multiespectral camera.

Bands 4 and 5 of this camera capture the VIS and NIR information that we need, respectively. Resolution at these bands is 20m per pixel, a lot less than the sub-meter imaginery of Google Maps, but enough for most crop fields. Band information for Sentinel-2, Landsat 8 and 7 is presented in this useful chart:

The satellite has a revisit time of about 16 days, so don’t expect daily updates. However, once Sentinel-2A and Sentinel-2B are available, it is expected that useful data will be available each 3-5 days.
The toolchain
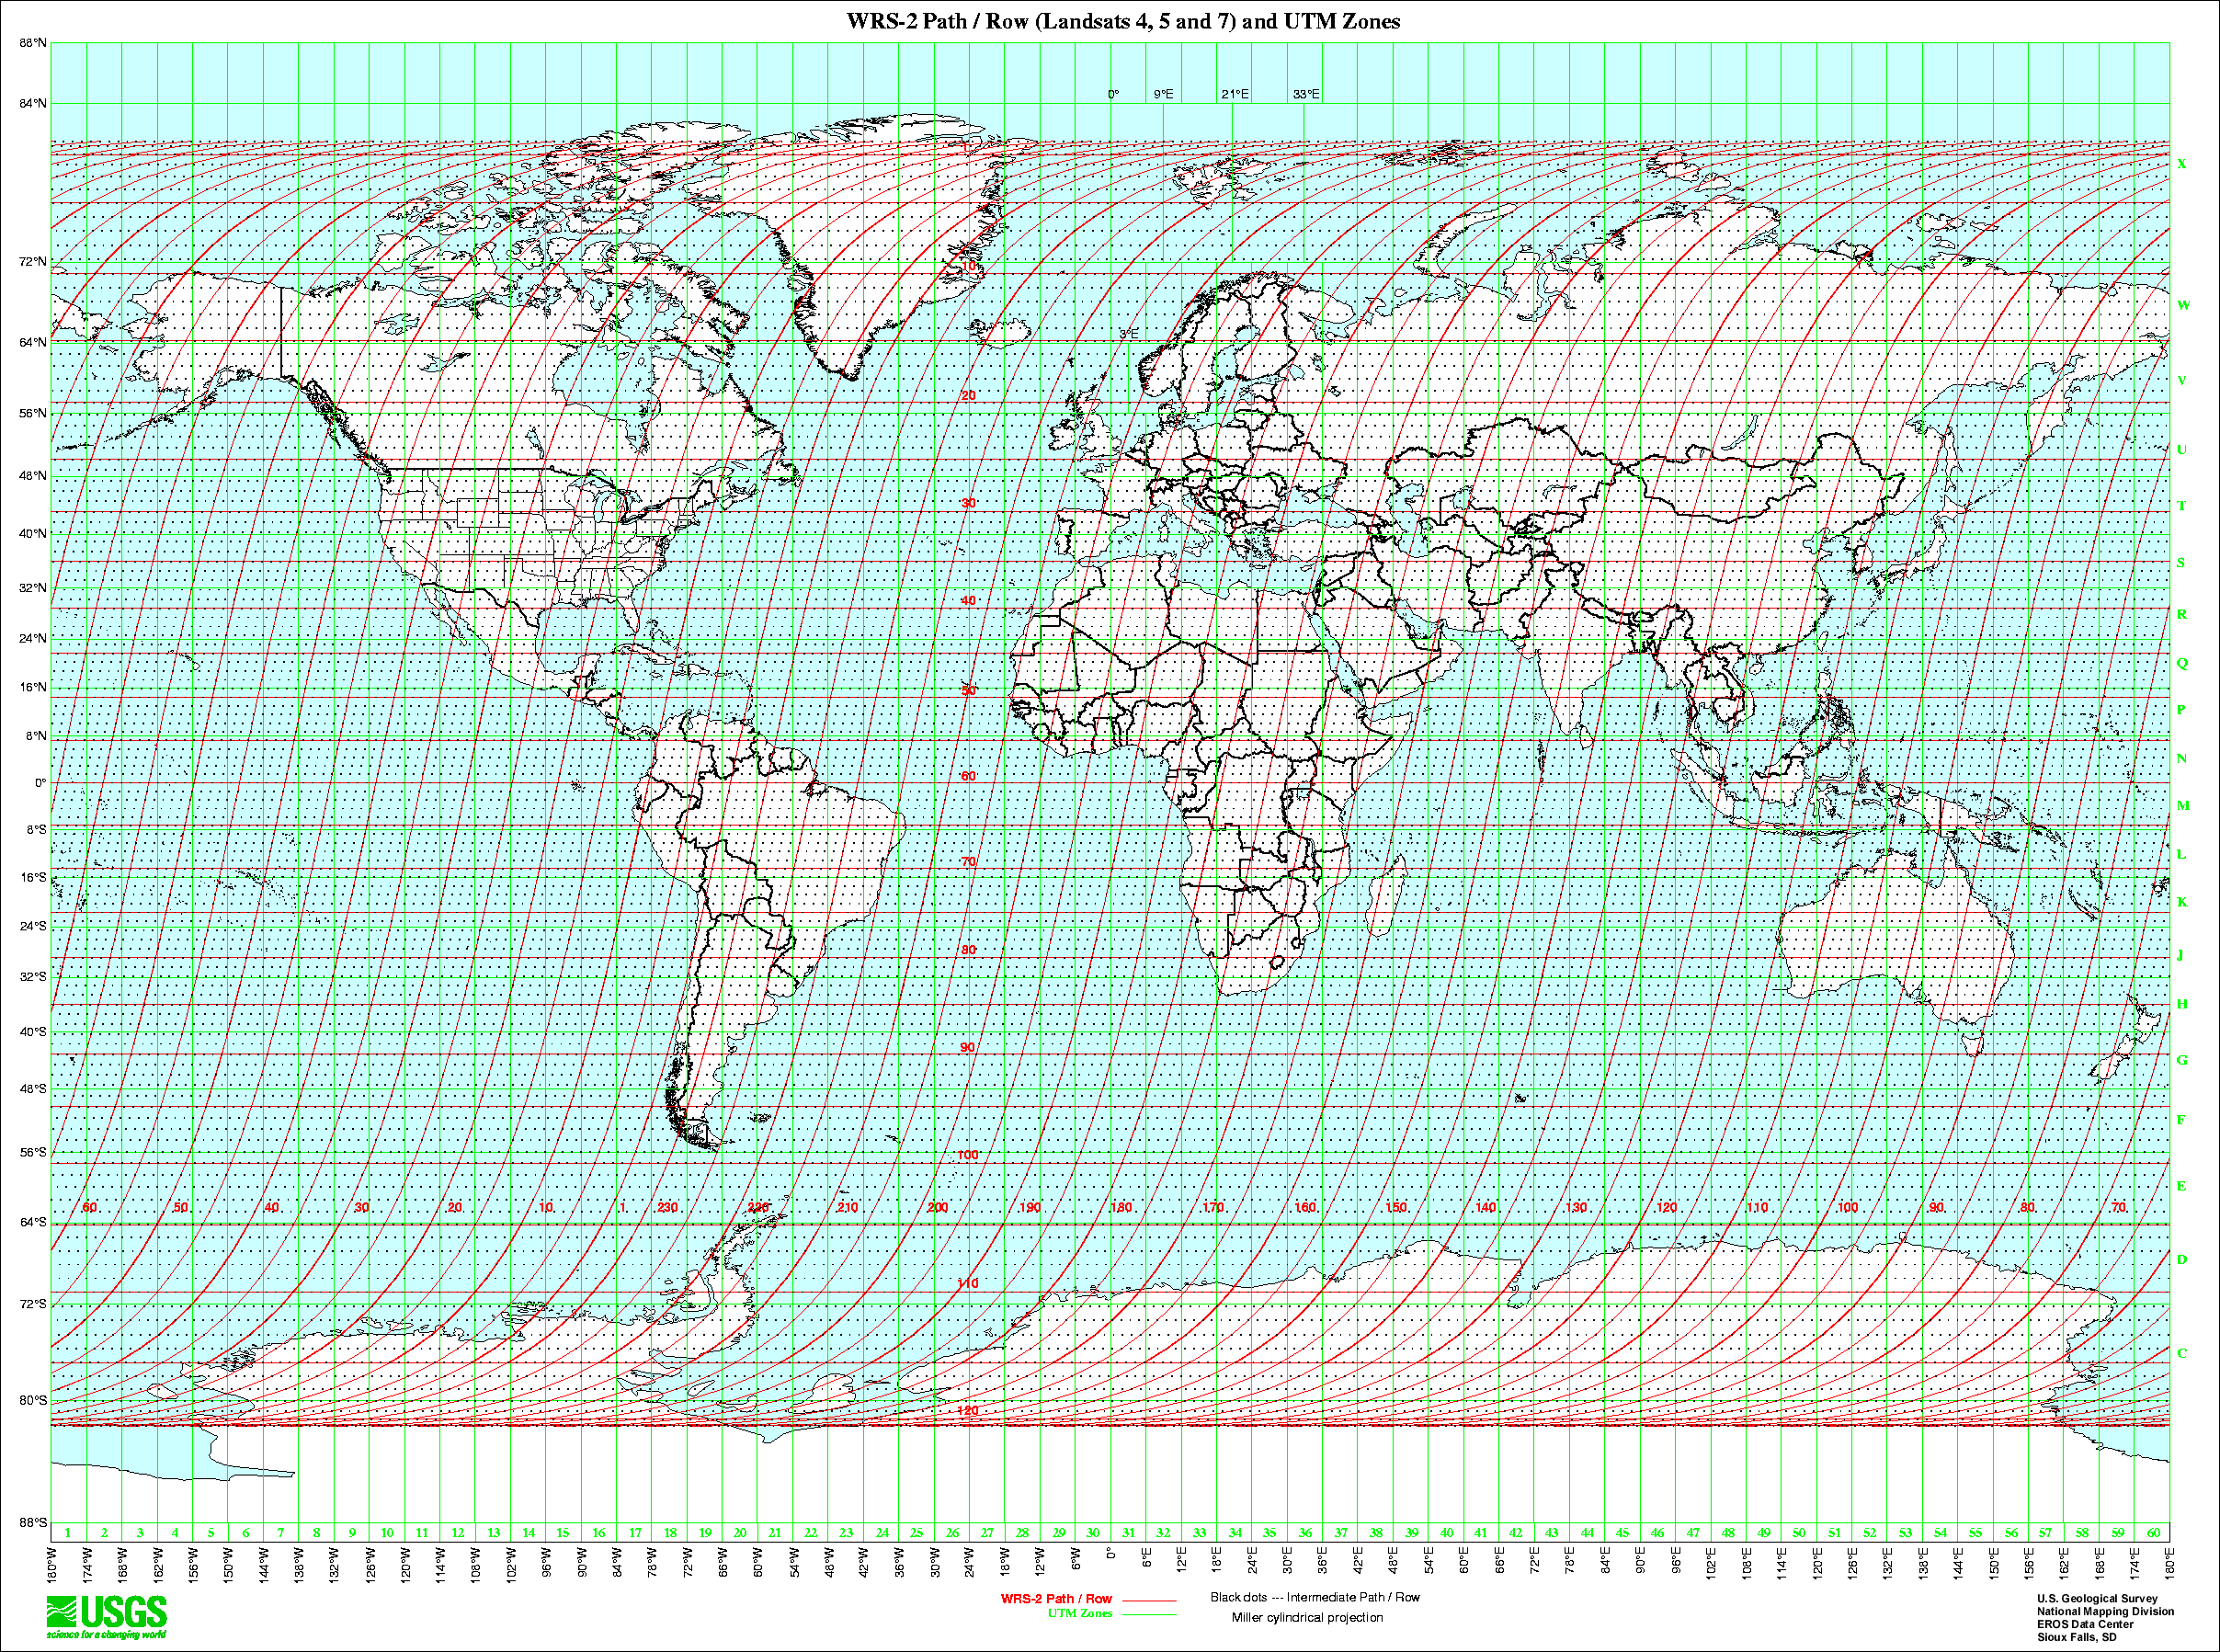
Data from Landsat 8 is distributed in huge scenes, numbered by path and row. A map is available here, but we can search and download them directly on Libra, a website built by Development Seed, who also develops the first tool of our open source toolchain:
Note: to illustrate this post, we will observe crops in the south east region of Spain: Albacete, Alicante, Valencia and Castellón.
Search, download and NDVI: Landsat-util
Instructions for installing this nice open source tool are available here. It has a wide array of functionality, being able to search, download, and process imaginery.
Searching for suitable imaginery
The first step must be to search for suitable satellite images of the selected area. For instance, if we only wanted scenes containing Albacete, we could search for coordinates [39º, -1.86º]:
1
landsat search --lat 39 --lon -1.86
This will result in a JSON output where each element is a scene, including cloud cover percentage, date of acquisition, path and row, satellite ID, scene ID, and a handy thumbnail:
1
2
3
4
5
6
7
8
9
10
{
    "cloud": 1.4,
    "date": "2014-10-26",
    "path": "199",
    "row": "033",
    "sat_type": "L8",
    "sceneID": "LC81990332014299LGN00",
    "thumbnail"
    "http://earthexplorer.usgs.gov/browse/landsat_8/2014/199/033/LC81990332014299LGN00.jpg"
}
We can filter these result by any parameter, including date, cloud cover, etc. An alternate way of finding suitable imaginery the Libra tool mentioned above, that relies on this same tool.
Note: However, landsat-util search allows us to set a cron job to update our imaginery as we wish!
As an illustrative example, two scenes have been selected. Contrast has been slightly enhanced, but these are the two thumbnails accesible from the search results:

Downloading the scenes
Once that we have selected the scenes that we want to download (LC81990332015158LGN00 and LC81990322015222LGN00 in this case), we download them using their sceneID parameter:
1
landsat download LC81990332015158LGN00 LC81990322015222LGN00
Computing NDVI
Each downloaded scene will download to a folder, defaulting to ~/landsat/processed/[sceneID] and contaning a GeoTIFF image for each band. We are interested in bands 4 (red VIS) and 5 (NIR). Recent versions of landsat-util include a routine to automatically compute the NDVI that we must call for each scene:
1
landsat process path/to/LC81990332015158LGN00 --ndvi
This will result in a GeoTIFF image [sceneID]_NDVI.TIFF in each scene folder. The images are colorized according to this colormap developed by @cfastie at Public Lab. Values close to 1 indicate high vegetation density, while 0 and less indicate no vegetation at all. For instance, we can zoom to see the NDVI map of the city of Valencia:

Join and tile: GDAL

In order to produce a continuous webmap, images must be stitched together and them divided into a lot of small tiles that can be loaded by the browser. We will use a some functions from GDAL, the Geospatial Data Abstraction Library, which was installed as a requirement of landsat-util.
Joining images
Two options are available: we can actually join the images to form a very big image or we can astutely create a “virtual dataset” or VRT: a simple text file that references all the individual images but can be viwwed and processed as one image, as seen on the right:
1
gdalbuildvrt -a_srs EPSG:3857 NDVImap.vrt **/*NDVI*
Note that we have selected projected coordinate system EPSG:3857, suitable for web maps, and instructed the tool to look on each subfolder ** for images containing a *NDVI* string
Dividing the image into tiles
One we have a virtual dataset file NDVImap.vrt, we need to divide it in several small tiles at each zoom level. We can use the standard GDAL-provided utility called gdal2tilesp.py, but an improved parallelized version is available here.
1
2
./gdal2tilesp.py -w none -s EPSG:3857 -p mercator -z 8-12
    --format=PNG --processes=8 -o tms NDVImap.vrt ndvi_tiles
Now we have a directory structure in the form Z/X/Y.png. The only remaining thing is to render these tiles in a webpage. That’s where the last piece of our open source toolchain enters.

Render the webmap: LeafletJS
Leaflet is a very powerful mapping JavaScript library. A lot of things can be achieved playing with it, but in this occasion we will just use it to render the tiles that we’ve generated. We start by including the library and the stylesheet into our webpage head:
1
2
<link rel="stylesheet" href="https://cdn.leafletjs.com/leaflet-0.7.5/leaflet.css"/>
<script src="https://cdn.leafletjs.com/leaflet-0.7.5/leaflet.js"></script>
Then, we have to include a <div> element that will contain our web map:
1
<div id="map" style="width:100%; height:500px"></div>
And now include a script to render the tiles as a map layer:
1
2
3
4
5
6
7
8
9
10
11
12
13
<script>
var map = L.map('map',{
        minZoom: 8,
        maxZoom: 12
    });                 //    Tile directory
                        //      |
var teselas = L.tileLayer('ndvi_tiles/{z}/{x}/{y}.png', {
        noWrap: true,
        tms: true
    }).addTo(map);

map.setView([39, -1.86], 12); // Albacete
</script>
And this is the end result: a scrollable web map showing NDVI data from Landsat. Of course, this could be customized by adding a search function, cadastral boundaries for a certain property (in places were they’re available as open data), etc., but the main work is done: from the raw satellite data to the web.
Note: in order to save space, this is a very cropped map of Albacete!
Conclussions & further work
Through this long and hopefully-not-so-boring post I’ve tried to describe the open source tools that I’ve found most useful when trying to test the feasibility of turning open satellite data into web maps.
As stated on the introduction, the reason behind this effort is that satellite data is difficult to work with, and most people (I’m thinking farmers in remote areas) often do not have the capabilities (computing power, bandwith, spare time to learn) required to make use of that data. It is thus interesting to explore ways to process relevant data into a form that allows an easy consumption and use, and probably websites are a good medium to disseminate this information.
However, none of this is useful if it is only made once, for the purpose of monitoring is to visualize change. As the satellite revisits the location, more and more imaginery is captured. It is thus important to create ways of automatically regenerating the map each time new suitable data is available in order to ensure that the information is up to date.
Now, thanks to the work of people like the Development Seed team, open source tools are available to programmatically search and acquire new images from Landsat 8. Hopefully, this trend will expand to other satellites like Sentinel-2, or even platforms like ISS that are being fitted with cameras and other sensors, and the data will reach those that need it the most.
 That's all for now! To share or comment go to this
permalink
That's all for now! To share or comment go to this
permalink
